LW Outside Day Strategy[SpeculationLab]This strategy is based on the concept of the Outside Day Pattern described by Larry Williams in his book “Long-Term Secrets to Short-Term Trading”.
The Outside Day is a classic price action pattern often seen during market reversals or acceleration phases.
Strategy Logic
Outside Bar Detection
Current day’s high is higher than the previous high, and the low is lower than the previous low.
A body-size filter is applied: only bars with significantly larger bodies than the previous bar are considered valid.
Directional Confirmation
Close below the previous day’s low → Buy signal.
Close above the previous day’s high → Sell signal.
Stop Loss Options
Prev Low/High: Uses the previous swing low/high with buffer adjustment.
ATR: Stop loss based on volatility (ATR).
Fixed Pips: Uses a fixed pip distance defined by the user.
Take Profit Options
Prev High/Low (PHL): Targets the previous swing high/low.
Risk-Reward (RR): Targets based on user-defined risk-to-reward ratio.
Following Price Open (FPO): Exits at the next day’s open if price opens in profit.
Signal Markers
Buy/Sell signals are plotted on the chart (triangles).
Stop loss and target reference lines are drawn automatically.
Usage Notes
Timeframe: Best suited for Daily charts.
Markets: Works across stocks, forex, and crypto markets.
Disclaimer: This strategy is for educational and research purposes only. It does not guarantee profits and should not be considered financial advice. Please manage your own risk responsibly.
本策略基于美国著名交易大师 Larry Williams 在其著作《Long-Term Secrets to Short-Term Trading(短线交易的长线秘诀)》中提出的 Outside Day(外包线形态)。外包线是一种典型的价格行为形态,常出现在趋势反转或加速阶段。
策略逻辑
外包线识别
当日最高价高于前一日最高价,且当日最低价低于前一日最低价,即形成外包线。
同时过滤掉较小实体的 K 线,仅保留实体显著大于前一根的形态。
方向过滤
收盘价低于前一日最低价 → 视为买入信号。
收盘价高于前一日最高价 → 视为卖出信号。
止损设置(可选参数)
前低/高止损:以形态前低/前高为止损,带有缓冲倍数。
ATR 止损:根据平均波动率(ATR)动态调整。
固定点数止损:按照用户设定的点数作为止损范围。
止盈设置(可选参数)
前高/低止盈(PHL):以前高/前低为目标。
固定盈亏比(RR):根据用户设定的风险回报比自动计算。
隔夜开盘(FPO):若次日开盘价高于进场价(多单)或低于进场价(空单),则平仓。
信号标记
在图表中标注买入/卖出信号(三角形标记)。
绘制止损与目标位参考线。
使用说明
适用周期:建议用于 日线图(Daily)。
适用市场:股票、外汇、加密货币等各类市场均可。
提示:此策略为历史研究与学习用途,不构成投资建议。实际交易请结合自身风险管理。
在脚本中搜索"Buy sell"

Hurst‑Millard FLD Normalized 2.0 – Signals "Hurst-Millard FLD Normalized 2.0 – Signals" indicator. It analyzes price data using a combination of moving averages (MAs) and the Hurst exponent to decompose price movements into trend, swing, and noise components, generating buy and sell signals. Here's a brief overview of its functionality:Inputs and Modes:Offers Auto Mode (cycle-based) and Manual Mode for configuring three moving averages: Long-Term (LT), Mid-Term (MT), and Short-Term (ST).
Auto Mode calculates MA lengths and offsets based on user-defined target cycle lengths (e.g., LT: 400 bars, MT: 100 bars, ST: 25 bars) with predefined offset ratios (0.2, 0.333, 0.5 respectively).
Manual Mode allows direct input of MA lengths and offsets.
Moving Averages:Computes Simple Moving Averages (SMAs) for LT, MT, and ST based on the closing price.
Applies forward-shifting to simulate future price behavior (e.g., maLongFwd shifts the LT MA by the specified offset).
Decomposition:Trend: Derived from the forward-shifted LT MA (maLongFwd).
Swing: Calculated as the difference between MT and LT MAs, scaled as a percentage of the closing price and amplified (using ATR or a manual factor).
Noise: Calculated as the difference between ST and MT MAs, similarly scaled and amplified.
Hurst Exponent:Estimates the Hurst exponent to measure the persistence or mean-reversion of the noise component.
Uses a 50-bar lookback period, smoothed with a 5-period SMA.
Signal Generation:Generates buy signals when the noise component is less than the swing component and their difference is within a user-defined proximity threshold (default: 25% of swing).
Generates sell signals when noise exceeds swing within the same threshold.
Signals are plotted as diamond shapes at the calculated proximity price level.
Visualization:Plots the trend, swing, and noise components as lines with customizable colors and gradient intensity based on their relative strength.
Optional debugging plots for raw forward-shifted MAs and proximity thresholds.
Displays a periodic debug table (every 100 bars) showing key metrics like close price, MAs, trend, swing, noise, Hurst exponent, and more.
Additional Features:Supports ATR-based amplification for scaling swing and noise.
Allows customization of signal colors, diamond offsets, and proximity thresholds.
Includes debugging options to visualize raw MAs and proximity bands.
In summary, this indicator uses cycle-based or manually configured MAs to break down price action into trend, swing, and noise, calculates the Hurst exponent for noise analysis, and generates buy/sell signals based on the relationship between swing and noise within a proximity threshold. It’s designed for traders to identify potential trend reversals or continuations.

Signal Core Basic [NevoxCore]⯁ OVERVIEW
Signal Core Basic is a clean and functional ATR-based trailing stop with BUY/SELL signals.
It modernizes the classic "UT-style" concept with adaptive sensitivity, multi-source inputs (Close, Heikin-Ashi, ZLEMA, KAMA), and compact visuals.
The tool is designed for traders who want a clear, minimal, and reliable base indicator without repainting issues.
⯁ HOW IT WORKS
Calculates an ATR-based trailing stop (nLoss = Key × ATR).
Adaptive mode scales sensitivity depending on trend strength (trend/range detection).
Trailing stop flips when price crosses from one regime to the other.
BUY/SELL signals trigger only when confirmed and not blocked by cooldown.
Label ring-buffer ensures chart stays clean (max 50 labels).
Bar coloring optional (solid), auto-disabled when classic red/green colors are enabled.
⯁ KEY FEATURES
ATR-based trailing stop with adjustable sensitivity.
Adaptive key (trend/range aware).
Multiple compute sources: Close, Heikin-Ashi, ZLEMA, KAMA.
Global confirm-on-close switch (no repaint).
Early-flip protection (cooldown).
Compact BUY/SELL labels with auto-cleanup (max 50).
Optional solid bar coloring.
Alerts with ticker, timeframe, and price included.
⯁ SETTINGS (quick overview)
Visual: Classic Colors, Show Labels, Plot Trailing Stop, Barcolor ON/OFF.
Source & Sensitivity: Key Value, ATR Length, Compute Source.
Advanced: Adaptive Key toggle with min/max bounds.
Global: Confirm on bar close.
Extras: Cooldown protection (bars).
⯁ ALERTS (built-in)
Basic Long: BUY signal.
Basic Short: SELL signal.
Each alert includes {{ticker}} {{interval}} @ {{close}}.
⯁ HOW TO USE
Use as a trailing stop and regime filter.
Combine BUY/SELL signals with your strategy rules.
Enable cooldown for cleaner signals in choppy markets.
Try ZLEMA or Heikin-Ashi as compute source for smoother performance.
⯁ WHY IT’S DIFFERENT
Unlike generic UT-style scripts, Signal Core Basic adds adaptive sensitivity, multiple input sources, and strict non-repaint safety.
The visuals follow NevoxCore’s design standards: compact, minimal, and clean — ready for live trading with alerts.
⯁ DISCLAIMER
Backtest and paper-trade before using live. Not financial advice.
Performance depends on market, timeframe, and parameters.
LA - Opening Price based Previous day Range PivotThis "LA - Opening Price based Previous day Range Pivot" indicator is a custom technical analysis tool designed for Trading View charts. It plots support and resistance levels (often referred to as pivots or ranges) based on the current opening price combined with the previous period's trading range. The "previous period" can be daily, weekly, or monthly, making it a multi-timeframe tool. These levels are projected using Fibonacci-inspired multipliers to create potential breakout or reversal zones.
The core idea is inspired by concepts like the Opening Range Breakout (ORB) strategy or Fibonacci pivots, but it's customized here to use a dynamic range calculation (the maximum of several absolute price differences) rather than a simple high-low range. This makes it more robust for volatile markets. Levels are symmetric above (resistance) and below (support) the opening price, helping traders identify potential entry/exit points, stop-losses, or targets. This will be useful when there is a gap-up/down as in Nifty/Sensex .
Purpose of the Indicator:
To visualize potential support/resistance zones for the current trading session based on the opening price and historical range data. This helps traders anticipate price movements, such as breakouts above resistance or bounces off support
Use Cases:
Intraday Trading: On lower timeframes (e.g., 5-min or 15-min charts), it shows daily levels for short-term trades.
Swing Trading: On higher timeframes (e.g., hourly or daily), it displays weekly/monthly levels for longer holds.
Range Identification: The filled bands highlight "zones" where price might consolidate or reverse.
Conditional Display: Levels only appear on appropriate timeframes (e.g., daily levels on intraday charts <60min), preventing clutter.
Theoretical Basis: It builds on pivot point theory, where the opening price acts as a central pivot. Multipliers (e.g., 0.618 for Fibonacci golden ratio) project levels, assuming price often respects these ratios due to market psychology.
How Calculations Work
Let's dive into the math with examples. Assume a stock with:
Current daily open (cdo) = $100
Previous daily high (pdh) = $105, low (pdl) = $95, close (pdc) = $102, close 2 days ago (pdc2) = $98
Step 1: Dynamic Range Calculation (var_d2):
This is the max of:
|pdh - pdc2| = |105 - 98| = 7
|pdl - pdc2| = |95 - 98| = 3
|pdh - pdl| = |105 - 95| = 10 (previous day range)
|pdh - cdo| = |105 - 100| = 5
|pdl - cdo| = |95 - 100| = 5
|pdc - cdo| = |102 - 100| = 2
|pdc2 - cdo| = |98 - 100| = 2
Max = 10 (so range = 10). This ensures the range accounts for gaps and extended moves, not just high-low.
Step 2: Level Projections:
Resistance (above open): Open + (Range * Multiplier)
dre6 = 100 + (10 * 1.5) = 115
dre5 = 100 + (10 * 1.27) ≈ 112.7
... down to dre0 = 100 + (10 * 0.1) = 101
dre50 = 100 + (10 * 0.5) = 105 (midpoint)
Support (below open): Open - (Range * Multiplier)
dsu0 = 100 - (10 * 0.1) = 99
... up to dsu6 = 100 - (10 * 1.5) = 85
Without Indicator
With Indicator
Pros and Cons
Pros:
Multi-Timeframe Flexibility: Seamlessly integrates daily, weekly, and monthly levels, useful for aligning short-term trades with longer trends (e.g., intraday breakout confirmed by weekly support).
Dynamic Range Calculation: Unlike standard pivots (just (H+L+C)/3), it uses max of multiple diffs, capturing gaps/volatility better—great for stocks with overnight moves.
Customizable via Inputs: Users can toggle levels, adjust multipliers, or change timeframes without editing code. Inline inputs keep the UI clean.
Visual Aids: Filled bands make zones obvious; conditional colors highlight "tight" vs. "wide" ranges (e.g., for volatility assessment).
Fibonacci Integration: Levels based on proven ratios, appealing to technical traders. Symmetric supports/resistances simplify strategy building (e.g., buy at support, sell at resistance).
No Repainting: Uses historical data with lookahead, so levels are fixed once calculated—reliable for back-testing.
Cons:
Chart Clutter: With all toggles on, 50+ plots/fills can overwhelm the chart, especially on mobile or small screens. Requires manual disabling.
Complexity for Beginners: Many inputs and calculations; without understanding fib ratios or range logic, it might confuse new users.
Performance Overhead: On low timeframes (e.g., 1-min), fetching higher TF data multiple times could lag, especially with many symbols or back-tests.
Assumes Volatility Persistence: Relies on previous range projecting future moves; in low-vol markets (e.g., sideways trends), levels may be irrelevant or too wide/narrow.
No Alerts or Signals: Purely visual; no built-in buy/sell alerts or crossover conditions—users must add separately.
Hardcoded Styles/Colors: Limited customization without code edits (e.g., can't change line styles via inputs).
Also, not optimized for non-stock assets (e.g., forex with 24/7 trading).
In summary, this is a versatile pivot tool for range-based trading based on Opening price, excelling in volatile markets but requiring some setup. If you're using it, start with defaults on a daily chart and toggle off unnecessary levels.

Linear Regression by Uttamwith Buy Sell Signal with regression channel
with Buy Sell Signal with regression channel
with Buy Sell Signal with regression channel
with Buy Sell Signal with regression channel

Elliott Wave Auto + Fib Targets + Scalper Strategy (Fixed)// Elliott Wave Auto + Fib Targets + Scalper Strategy
//
// Fixed by expert trader:
// - Replaced table with label-based visualization to avoid 'Column 2 is out of table bounds' error.
// - Uses label.new to display buy/sell signal counts in top-right corner, mimicking table layout.
// - Fixed array.sum() error: Replaced invalid range-based array.sum() with custom sum_array_range() function.
// - Removed barstate usage to fix 'Undeclared identifier barstate' error.
// - Replaced barstate.isconfirmed with true (process every bar).
// - Replaced barstate.isfirstconfirmed with bar_index == 0 (first bar).
// - Replaced strategy.alert with label.new for long/short entry signals (buy/sell markers).
// - Fixed array index out-of-bounds: Protected array.get() calls with size checks.
// - Fixed pyramiding: Set constant pyramiding=4 (max 5 entries); use allow_pyramiding to limit entries.
// - Fixed default_qty_value: Set constant default_qty_value=100.0; use entry_size_pct to scale qty.
// - Replaced alertcondition with labels for Elliott Wave patterns.
// - Fixed partial exits: 50% at TP1 with fixed SL, 50% at TP2 with fixed SL or trailing.
// - Fixed Elliott Wave pivot indexing for alternating H/L check.
// - Ensured proper position sizing and exit logic.
RSI ROC Signals with Price Action# RSI ROC Signals with Price Action
## Overview
The RSI ROC (Rate of Change) Signals indicator is an advanced momentum-based trading system that combines RSI velocity analysis with price action confirmation to generate high-probability buy and sell signals. This indicator goes beyond traditional RSI analysis by measuring the speed of RSI changes and requiring price confirmation before triggering signals.
## Core Concept: RSI Rate of Change (ROC)
### What is RSI ROC?
RSI ROC measures the **velocity** or **acceleration** of the RSI indicator, providing insights into momentum shifts before they become apparent in traditional RSI readings.
**Formula**: `RSI ROC = ((Current RSI - Previous RSI) / Previous RSI) × 100`
### Why RSI ROC is Superior to Standard RSI:
1. **Early Momentum Detection**: Identifies momentum shifts before RSI reaches traditional overbought/oversold levels
2. **Velocity Analysis**: Measures the speed of momentum changes, not just absolute levels
3. **Reduced False Signals**: Filters out weak momentum moves that don't sustain
4. **Dynamic Thresholds**: Adapts to market volatility rather than using fixed RSI levels
5. **Leading Indicator**: Provides earlier signals compared to traditional RSI crossovers
## Signal Generation Logic
### 🟢 Buy Signal Process (3-Stage System):
#### Stage 1: Trigger Activation
- **RSI ROC** > threshold (default 7%) - RSI accelerating upward
- **Price ROC** > 0 - Price moving higher
- Records the **trigger high** (highest point during trigger)
#### Stage 2: Invalidation Check
- Signal invalidated if **RSI ROC** drops below negative threshold
- Prevents false signals during momentum reversals
#### Stage 3: Confirmation
- **Price breaks above trigger high** - Price action confirmation
- **Current candle is green** (close > open) - Bullish price action
- **State alternation** - Ensures no consecutive duplicate signals
### 🔴 Sell Signal Process (3-Stage System):
#### Stage 1: Trigger Activation
- **RSI ROC** < negative threshold (default -7%) - RSI accelerating downward
- **Price ROC** < 0 - Price moving lower
- Records the **trigger low** (lowest point during trigger)
#### Stage 2: Invalidation Check
- Signal invalidated if **RSI ROC** rises above positive threshold
- Prevents false signals during momentum reversals
#### Stage 3: Confirmation
- **Price breaks below trigger low** - Price action confirmation
- **Current candle is red** (close < open) - Bearish price action
- **State alternation** - Ensures no consecutive duplicate signals
## Key Features
### 🎯 **Smart Signal Management**
- **State Alternation**: Prevents signal clustering by alternating between buy/sell states
- **Trigger Invalidation**: Automatically cancels weak signals that lose momentum
- **Price Confirmation**: Requires actual price breakouts, not just momentum shifts
- **No Repainting**: Signals are confirmed and won't disappear or change
### ⚙️ **Customizable Parameters**
#### **RSI Length (Default: 14)**
- Standard RSI calculation period
- Shorter periods = more sensitive to price changes
- Longer periods = smoother, less noisy signals
#### **Lookback Period (Default: 1)**
- Period for ROC calculations
- 1 = compares to previous bar (most responsive)
- Higher values = smoother momentum detection
#### **RSI ROC Threshold (Default: 7%)**
- Minimum RSI velocity required for signal trigger
- Lower values = more signals, potentially more noise
- Higher values = fewer but higher-quality signals
### 📊 **Visual Signals**
- **Green Arrow Up**: Buy signal below price bar
- **Red Arrow Down**: Sell signal above price bar
- **Clean Chart**: No additional lines or oscillators cluttering the view
- **Size Options**: Customizable arrow sizes for visibility preferences
## Advantages Over Traditional Indicators
### vs. Standard RSI:
✅ **Earlier Signals**: Detects momentum changes before RSI reaches extremes
✅ **Dynamic Thresholds**: Adapts to market conditions vs. fixed 30/70 levels
✅ **Velocity Focus**: Measures momentum speed, not just position
✅ **Better Timing**: Combines momentum with price action confirmation
### vs. Moving Average Crossovers:
✅ **Leading vs. Lagging**: RSI ROC is forward-looking vs. backward-looking MAs
✅ **Volatility Adaptive**: Automatically adjusts to market volatility
✅ **Fewer Whipsaws**: Built-in invalidation logic reduces false signals
✅ **Momentum Focus**: Captures acceleration, not just direction changes
### vs. MACD:
✅ **Price-Normalized**: RSI ROC works consistently across different price ranges
✅ **Simpler Logic**: Clear trigger/confirmation process vs. complex crossovers
✅ **Built-in Filters**: Automatic signal quality control
✅ **State Management**: Prevents over-trading through alternation logic
## Trading Applications
### 📈 **Trend Following**
- Use in trending markets to catch momentum continuations
- Combine with trend filters for directional bias
- Excellent for breakout strategies
### 🔄 **Swing Trading**
- Ideal timeframes: 4H, Daily, Weekly
- Captures major momentum shifts
- Perfect for position entries/exits
### ⚡ **Scalping (Advanced Users)**
- Lower timeframes: 1m, 5m, 15m
- Reduce threshold for more frequent signals
- Combine with volume confirmation
### 🎯 **Momentum Strategies**
- Perfect for momentum-based trading systems
- Identifies acceleration phases in trends
- Complements breakout and continuation patterns
## Optimization Guidelines
### **Conservative Settings (Lower Risk)**
- RSI Length: 21
- ROC Threshold: 10%
- Lookback: 2
### **Standard Settings (Balanced)**
- RSI Length: 14 (default)
- ROC Threshold: 7% (default)
- Lookback: 1 (default)
### **Aggressive Settings (Higher Frequency)**
- RSI Length: 7
- ROC Threshold: 5%
- Lookback: 1
## Best Practices
### 🎯 **Entry Strategy**
1. Wait for signal arrow confirmation
2. Consider market context (trend, support/resistance)
3. Use proper position sizing based on volatility
4. Set stop-loss below/above trigger levels
### 🛡️ **Risk Management**
1. **Stop Loss**: Place beyond trigger high/low levels
2. **Position Sizing**: Use 1-2% risk per trade
3. **Market Context**: Avoid counter-trend signals in strong trends
4. **Time Filters**: Consider avoiding signals near major news events
### 📊 **Backtesting Recommendations**
1. Test on multiple timeframes and instruments
2. Analyze win rate vs. average win/loss ratio
3. Consider transaction costs in backtesting
4. Optimize threshold values for different market conditions
## Technical Specifications
- **Pine Script Version**: v6
- **Signal Type**: Non-repainting, confirmed signals
- **Calculation Basis**: RSI velocity with price action confirmation
- **Update Frequency**: Real-time on bar close
- **Memory Management**: Efficient state tracking with minimal resource usage
## Ideal For:
- **Momentum Traders**: Captures acceleration phases
- **Swing Traders**: Medium-term position entries/exits
- **Breakout Traders**: Confirms momentum behind breakouts
- **System Traders**: Mechanical signal generation with clear rules
This indicator represents a significant evolution in momentum analysis, combining the reliability of RSI with the precision of rate-of-change analysis and the confirmation of price action. It's designed for traders who want sophisticated momentum detection with built-in quality controls.

CNagda Anchor2EntryCNagda Anchor2Entry Pine Script v6 overlay indicator pulls higher-timeframe (HTF) signal events to define anchor high/low levels and then projects visual entry labels on the lower-timeframe (LTF). It also draws auto-oriented Fibonacci retracement/extension levels for context, but it does not execute orders, stops, or targets—only visual guidance.
Inputs
Key inputs include Lookback Length for HTF scanning and a Signal Timeframe used with request.security to import HTF events onto the active chart.
Entry behavior can be set to “Confirm only” or “Wait candle,” trade side can be restricted to Buy/Sell/Both, and individual strategies (Buy WAIT/S1; Sell REV/S1/S2/S3) can be toggled.
HTF logic
The script defines WAIT/BUY setup and confirmation, SELL reversal on breaking the WAIT BUY low, and several volume/candle-based patterns (Sell S1/S2/S3, Buy S1).
It captures the associated highs/lows at those events with ta.valuewhen and imports them via request.security to form anchors (anc_hi/anc_lo) and “new trigger” booleans that gate label creation on the LTF.
Flip entries
When enabled, “Flip entries” generate contrarian labels based on breaking or confirming HTF anchors: crossing above anc_hi can trigger a flip-to-sell label, and crossing below anc_lo can trigger a flip-to-buy label.
The flip mode supports Immediate (on cross) or Confirm (on sustained break) to control how strict the trigger is.
Fibonacci drawing
User-specified Fib levels are parsed from a string, safely converted to floats, and drawn as dotted horizontal lines only when they fall inside an approximate visible viewport. Orientation (up or down) is decided automatically from pending signal direction and a simple context score (candle bias, trend, and price vs. mid), with efficient redraw/clear guards to avoid clutter.
Dynamic anchors
If HTF anchors are missing or too far from current price (checked with an ATR-based threshold), the script falls back to local swing highs/lows to keep the reference range relevant. This dynamic switch helps Fib levels and labels remain close to current market structure without manual intervention.
Signal labels
Labels are created only on confirmed bars to avoid repainting noise, with one “latest” label kept by deleting the previous one. The script places BUY/SELL labels for WAIT/CONFIRM, direct HTF patterns (Buy S1, Sell S1/S2/S3), and contrarian flip events, offset slightly from highs/lows with clear coloring and configurable sizes.
Visual context
Bars are softly colored (lime tint for bullish, orange tint for bearish) for quick context, and everything renders as an overlay on the price chart. Fib labels include a Δ readout (distance from current close), and line extension length, label sizes, and viewport padding are adjustable.
How to use
Set the Signal Timeframe and Lookback Length to establish which HTF structures and ranges will drive the anchors and entry conditions. Choose entry flow (Wait vs Confirm), enable Flip if contrarian triggers are desired, select the trade side, toggle strategies, and customize Fibonacci levels plus dynamic-anchor fallback for practical on-chart guidance.
Notes
This is a visual decision-support tool; it does not place trades, stops, or targets and should be validated on charts before live use. It is written for Pine Script v6 and relies heavily on request.security for HTF-to-LTF transfer of signals and anchors.

EMA Ribbon - Adjustable with Toggles📌 Script Name:
EMA Ribbon - Adjustable with Toggles
🧠 Primary Function:
This script plots a customizable Exponential Moving Average (EMA) Ribbon on Trading View charts. It allows the user to enable or disable any of the 8 EMAs individually and shows buy/sell signals based on the crossover between the fastest and slowest EMAs.
⚙️ Key Features:
✅ User Controls:
Toggle ON/OFF each of the 8 EMAs independently.
Set the length of each EMA (from 1 upward).
EMA colors vary based on their speed (green for faster, orange for slower).
📈 EMA Calculation:
Calculates 8 separate EMAs using the closing price (close).
🎨 Chart Visualization:
Plots each EMA with a unique color and transparency.
Draws a colored ribbon between the highest and lowest active EMAs to visualize trend zones.
📊 Trend Direction Logic:
The trend is determined solely based on EMA 1 (fastest) and EMA 8 (slowest).
A bullish trend is when EMA 1 > EMA 8, and bearish when EMA 1 < EMA 8.
📍 Buy/Sell Signals:
Buy Signal: When the trend shifts from bearish to bullish (EMA 1 crosses above EMA 8).
Sell Signal: When the trend shifts from bullish to bearish (EMA 1 crosses below EMA 8).
Signals are displayed as green (buy) and red (sell) triangles on the chart.
🔔 Alerts:
Built-in alert conditions for buy and sell signals.
Custom alert messages in Arabic (can be modified if needed).
🌟 Additional Highlights:
Well-structured and easy to expand.
Great for trend-following strategies using EMA ribbons.
Helps identify consolidation zones and trend confirmation.
🚀 ETH Price LinesThis Pine Script strategy ("🚀 ETH Price Lines") does:
Trend detection with short & long SMAs
Noise reduction using Kalman filters
Signal confirmation from ADX (trend strength) + volume
Entry/exit:
Buy when short-term crosses above long-term
Sell when it crosses below
Risk management: optional stop-loss (default 3%)
Visuals: plots SMAs, Kalman lines, buy/sell markers, and triggers alerts
EvoTrend-X Indicator — Evolutionary Trend Learner ExperimentalEvoTrend-X Indicator — Evolutionary Trend Learner
NOTE: This is an experimental Pine Script v6 port of a Python prototype. Pine wasn’t the original research language, so there may be small quirks—your feedback and bug reports are very welcome. The model is non-repainting, MTF-safe (lookahead_off + gaps_on), and features an adaptive (fitness-based) candidate selector, confidence gating, and a volatility filter.
⸻
What it is
EvoTrend-X is adaptive trend indicator that learns which moving-average length best fits the current market. It maintains a small “population” of fast EMA candidates, rewards those that align with price momentum, and continuously selects the best performer. Signals are gated by a multi-factor Confidence score (fitness, strength vs. ATR, MTF agreement) and a volatility filter (ATR%). You get a clean Fast/Slow pair (for the currently best candidate), optional HTF filter, a fitness ribbon for transparency, and a themed info panel with a one-glance STATUS readout.
Core outputs
• Selected Fast/Slow EMAs (auto-chosen from candidates via fitness learning)
• Spread cross (Fast – Slow) → visual BUY/SELL markers + alert hooks
• Confidence % (0–100): Fitness ⊕ Distance vs. ATR ⊕ MTF agreement
• Gates: Trend regime (Kaufman ER), Volatility (ATR%), MTF filter (optional)
• Candidate Fitness Ribbon: shows which lengths the learner currently prefers
• Export plot: hidden series “EvoTrend-X Export (spread)” for downstream use
⸻
Why it’s different
• Evolutionary learning (on-chart): Each candidate EMA length gets rewarded if its slope matches price change and penalized otherwise, with a gentle decay so the model forgets stale regimes. The best fitness wins the right to define the displayed Fast/Slow pair.
• Confidence gate: Signals don’t light up unless multiple conditions concur: learned fitness, spread strength vs. volatility, and (optionally) higher-timeframe trend.
• Volatility awareness: ATR% filter blocks low-energy environments that cause death-by-a-thousand-whipsaws. Your “why no signal?” answer is always visible in the STATUS.
• Preset discipline, Custom freedom: Presets set reasonable baselines for FX, equities, and crypto; Custom exposes all knobs and honors your inputs one-to-one.
• Non-repainting rigor: All MTF calls use lookahead_off + gaps_on. Decisions use confirmed bars. No forward refs. No conditional ta.* pitfalls.
⸻
Presets (and what they do)
• FX 1H (Conservative): Medium candidates, slightly higher MinConf, modest ATR% floor. Good for macro sessions and cleaner swings.
• FX 15m (Active): Shorter candidates, looser MinConf, higher ATR% floor. Designed for intraday velocity and decisive sessions.
• Equities 1D: Longer candidates, gentler volatility floor. Suits index/large-cap trend waves.
• Crypto 1H: Mid-short candidates, higher ATR% floor for 24/7 chop, stronger MinConf to avoid noise.
• Custom: Your inputs are used directly (no override). Ideal for systematic tuning or bespoke assets.
⸻
How the learning works (at a glance)
1. Candidates: A small set of fast EMA lengths (e.g., 8/12/16/20/26/34). Slow = Fast × multiplier (default ×2.0).
2. Reward/decay: If price change and the candidate’s Fast slope agree (both up or both down), its fitness increases; otherwise decreases. A decay constant slowly forgets the distant past.
3. Selection: The candidate with highest fitness defines the displayed Fast/Slow pair.
4. Signal engine: Crosses of the spread (Fast − Slow) across zero mark potential regime shifts. A Confidence score and gates decide whether to surface them.
⸻
Controls & what they mean
Learning / Regime
• Slow length = Fast ×: scales the Slow EMA relative to each Fast candidate. Larger multiplier = smoother regime detection, fewer whipsaws.
• ER length / threshold: Kaufman Efficiency Ratio; above threshold = “Trending” background.
• Learning step, Decay: Larger step reacts faster to new behavior; decay sets how quickly the past is forgotten.
Confidence / Volatility gate
• Min Confidence (%): Minimum score to show signals (and fire alerts). Raising it filters noise; lowering it increases frequency.
• ATR length: The ATR window for both the ATR% filter and strength normalization. Shorter = faster, but choppier.
• Min ATR% (percent): ATR as a percentage of price. If ATR% < Min ATR% → status shows BLOCK: low vola.
MTF Trend Filter
• Use HTF filter / Timeframe / Fast & Slow: HTF Fast>Slow for longs, Fast threshold; exit when spread flips or Confidence decays below your comfort zone.
2) FX index/majors, 15m (active intraday)
• Preset: FX 15m (Active).
• Gate: MinConf 60–70; Min ATR% 0.15–0.30.
• Flow: Focus on session opens (LDN/NY). The ribbon should heat up on shorter candidates before valid crosses appear—good early warning.
3) SPY / Index futures, 1D (positioning)
• Preset: Equities 1D.
• Gate: MinConf 55–65; Min ATR% 0.05–0.12.
• Flow: Use spread crosses as regime flags; add timing from price structure. For adds, wait for ER to remain trending across several bars.
4) BTCUSD, 1H (24/7)
• Preset: Crypto 1H.
• Gate: MinConf 70–80; Min ATR% 0.20–0.35.
• Flow: Crypto chops—volatility filter is your friend. When ribbon and HTF OK agree, favor continuation entries; otherwise stand down.
⸻
Reading the Info Panel (and fixing “no signals”)
The panel is your self-diagnostic:
• HTF OK? False means the higher-timeframe EMAs disagree with your intended side.
• Regime: If “Chop”, ER < threshold. Consider raising the threshold or waiting.
• Confidence: Heat-colored; if below MinConf, the gate blocks signals.
• ATR% vs. Min ATR%: If ATR% < Min ATR%, status shows BLOCK: low vola.
• STATUS (composite):
• BLOCK: low vola → increase Min ATR% down (i.e., allow lower vol) or wait for expansion.
• BLOCK: HTF filter → disable HTF or align with the HTF tide.
• BLOCK: confidence → lower MinConf slightly or wait for stronger alignment.
• OK → you’ll see markers on valid crosses.
⸻
Alerts
Two static alert hooks:
• BUY cross — spread crosses up and all gates (ER, Vol, MTF, Confidence) are open.
• SELL cross — mirror of the above.
Create them once from “Add Alert” → choose the condition by name.
⸻
Exporting to other scripts
In your other Pine indicators/strategies, add an input.source and select EvoTrend-X → “EvoTrend-X Export (spread)”. Common uses:
• Build a rule: only trade when exported spread > 0 (trend filter).
• Combine with your oscillator: oscillator oversold and spread > 0 → buy bias.
⸻
Best practices
• Let it learn: Keep Learning step moderate (0.4–0.6) and Decay close to 1.0 (e.g., 0.99–0.997) for smooth regime memory.
• Respect volatility: Tune Min ATR% by asset and timeframe. FX 1H ≈ 0.10–0.20; crypto 1H ≈ 0.20–0.35; equities 1D ≈ 0.05–0.12.
• MTF discipline: HTF filter removes lots of “almost” trades. If you prefer aggressive entries, turn it off and rely more on Confidence.
• Confidence as throttle:
• 40–60%: exploratory; expect more signals.
• 60–75%: balanced; good daily driver.
• 75–90%: selective; catch the clean stuff.
• 90–100%: only A-setups; patient mode.
• Watch the ribbon: When shorter candidates heat up before a cross, momentum is forming. If long candidates dominate, you’re in a slower trend cycle.
⸻
Non-repainting & safety notes
• All request.security() calls use lookahead=barmerge.lookahead_off, gaps=barmerge.gaps_on.
• No forward references; decisions rely on confirmed bar data.
• EMA lengths are simple ints (no series-length errors).
• Confidence components are computed every bar (no conditional ta.* traps).
⸻
Limitations & tips
• Chop happens: ER helps, but sideways microstructure can still flicker—use Confidence + Vol filter as brakes.
• Presets ≠ oracle: They’re sensible baselines; always tune MinConf and Min ATR% to your venue and session.
• Theme “Auto”: Pine cannot read chart theme; “Auto” defaults to a Dark-friendly palette.
⸻
Publisher’s Screenshots Checklist
1) FX swing — EURUSD 1H
• Preset: FX 1H (Conservative)
• Params: MinConf=70, ATR Len=14, Min ATR%=0.12, MTF ON (TF=4H, 20/50)
• Show: Clear BUY cross, STATUS=OK, green regime background; Fitness Ribbon visible.
2) FX intraday — GBPUSD 15m
• Preset: FX 15m (Active)
• Params: MinConf=60, ATR Len=14, Min ATR%=0.20, MTF ON (TF=60m)
• Show: SELL cross near London session open. HTF lines enabled (translucent).
• Caption: “GBPUSD 15m • Active session sell with MTF alignment.”
3) Indices — SPY 1D
• Preset: Equities 1D
• Params: MinConf=60, ATR Len=14, Min ATR%=0.08, MTF ON (TF=1W, 20/50)
• Show: Longer trend run after BUY cross; regime shading shows persistence.
• Caption: “SPY 1D • Trend run after BUY cross; weekly filter aligned.”
4) Crypto — BINANCE:BTCUSDT 1H
• Preset: Crypto 1H
• Params: MinConf=75, ATR Len=14, Min ATR%=0.25, MTF ON (TF=4H)
• Show: BUY cross + quick follow-through; Ribbon warming (reds/yellows → greens).
• Caption: “BTCUSDT 1H • Momentum break with high confidence and ribbon turning.”

Gap Zones Pro - Price Action Confluence Indicator with Alerts█ OVERVIEW
Gap Zones Pro identifies and tracks price gaps - crucial areas where institutional interest and market imbalance create high-probability reaction zones. These gaps represent areas of strong initial buying/selling pressure that often act as magnets when price returns.
█ WHY GAPS MATTER IN TRADING
- Gaps reveal institutional footprints and areas of market imbalance
- When price returns to a gap, it often reaffirms the original directional bias
- Failed gap reactions can signal powerful reversals in the opposite direction
- Gaps provide excellent confluence when aligned with your trading narrative
- They act as natural support/resistance zones with clear risk/reward levels
█ KEY FEATURES
- Automatically detects and visualizes all gap zones on your chart
- Extends gaps to the right edge for easy monitoring
- Customizable number of gaps displayed (manage chart clarity)
- Minimum gap size filter to focus on significant gaps only
- Real-time alerts when price enters gap zones
- Color-coded visualization (green for gap ups, red for gap downs)
- Clean, professional appearance with adjustable transparency
█ HOW TO USE
1. Add to chart and adjust maximum gaps displayed based on your timeframe
2. Set minimum gap size % to filter out noise (0.5-1% recommended for stocks)
3. Watch for price approaching gap zones for potential reactions
4. Use gaps as confluence with other technical factors:
- Support/resistance levels
- Fibonacci retracements
- Supply/demand zones
- Trend lines and channels
5. Set alerts to notify you when price enters key gap zones
█ TRADING TIPS
- Gaps with strong contextual stories (earnings, news, breakouts) are most reliable
- Multiple gaps in the same area create stronger zones
- Unfilled gaps above price can act as resistance targets
- Unfilled gaps below price can act as support targets
- Watch for "gap and go" vs "gap fill" scenarios based on market context
█ SETTINGS
- Maximum Number of Gaps: Control how many historical gaps to display
- Minimum Gap Size %: Filter out insignificant gaps
- Colors: Customize gap up and gap down zone colors
- Transparency: Adjust visibility while maintaining chart readability
- Show Borders: Toggle gap zone borders on/off
- Alerts: Automatic notifications when price crosses gap boundaries
█ BEST TIMEFRAMES
Works on all timeframes but most effective on:
- Daily charts for swing trading
- 4H for intraday position trading
- 1H for day trading key levels
- Weekly for long-term investing
Remember: Gaps are most powerful when they align with your overall market thesis and other technical confluences. They should confirm your narrative, not define it.
---
Updates: Real-time gap detection | Alert system | Extended visualization | Performance optimized

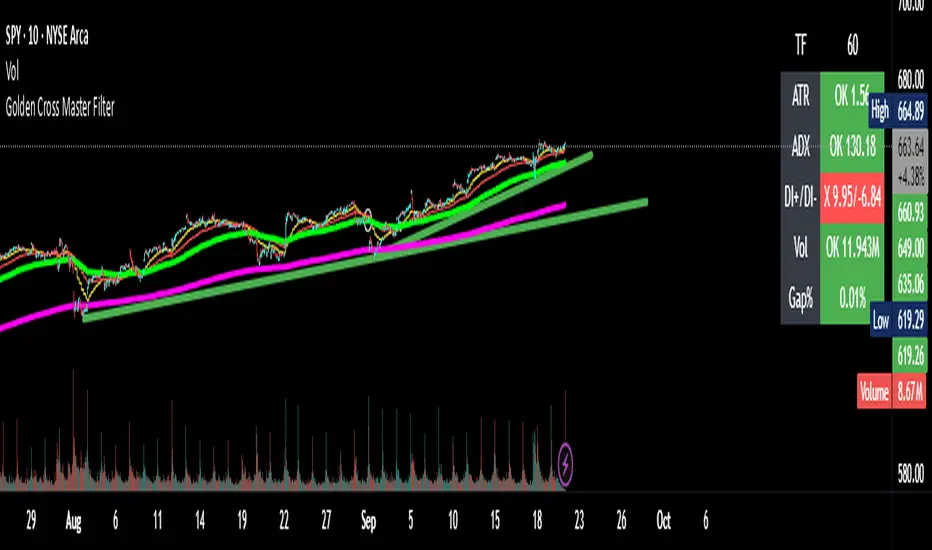
Golden Cross Master Filter by Carlos ChavezForget noisy Golden/Death Cross signals.
This is the **Golden Cross Master Filter** – built for traders who demand institutional-level confirmation.
✅ Exact EMA cross points with circle markers
✅ ATR / ADX / DI+ / DI- / Volume filters
✅ Gap% detection
✅ Visual OK/X dashboard
✅ Instant BUY/SELL labels & ready-to-use alerts
Cut the noise. Trade only the strongest crosses. 🚀
Golden Cross Master Filter is a professional tool to detect Golden and Death Crosses with institutional-grade filtering.
🚀 Features:
- ✅ ATR / ADX / DI+/DI- / Volume conditions
- ✅ Gap% detection (daily gap between yesterday’s close and today’s open)
- ✅ Visual dashboard with OK/X status
- ✅ Exact circle markers at EMA cross points
- ✅ Ready-to-use BUY/SELL labels when filters are confirmed
- ✅ Built-in alerts for easy automation
This indicator is designed for intraday and swing traders who rely on EMA crosses but want to eliminate false signals.
It works across multiple timeframes (10m, 1h, 4h, Daily) and adapts to different trading styles.
Whether you trade CALLs/PUTs or just want stronger confirmation for Golden/Death Crosses, this filter helps you focus only on high-probability setups.
ORB + Session VWAP Pro (London & NY) — fixedORB + Session VWAP Pro (London & NY) — Listing copy (EN)
What it is
A clean, non-repainting intraday tool that fuses the classic Opening Range Breakout (ORB) with a session-anchored VWAP filter for London and New York. It highlights only the higher-quality breakouts (above/below session VWAP), adds an optional retest confirmation, and scores each signal with an intuitive Confidence metric (0–100).
Why it works
• ORB provides the day’s first actionable structure (range high/low).
• Session VWAP filters “cheap” breaks and favors flows aligned with session value.
• Optional retest reduces first-tick whipsaws.
• Confidence blends breakout depth (vs ATR), VWAP slope and band distance.
Key visuals
• LDN/NY OR High/Low (line break style) + optional OR boxes.
• Active Session VWAP (resets per signal window; falls back to daily VWAP outside).
• Optional VWAP bands (stdev or %).
• Session shading (London/NY windows).
• Signal markers (LDN BUY/SELL, NY BUY/SELL) fired with cooldown.
Signals
• London Long / Short: Break of LDN OR High/Low ± ATR buffer, aligned with VWAP side.
• NY Long / Short: Same logic during NY window.
• Retest (optional): Requires a tag back to the OR level ± tolerance before confirmation.
• Confidence: 0–100; gate via Min Confidence (default 55).
Inputs that matter
• Open Range Length (min): Default 15.
• London/NY times & timezones.
• ATR buffer & retest tolerance.
• Bands mode: Stdev (with lookback) or % (e.g., 1%).
• Signal cooldown: Avoids clutter on fast moves.
Non-repaint policy
• OR lines build within fixed time windows using the current bar’s timestamp.
• VWAP is cumulative within the session window; no lookahead.
• All ta.crossover/ta.crossunder are precomputed every bar (no conditional execution).
• Signals are based on live bar values, not future bars.
⸻
Quick start (examples)
1) EURUSD, London momentum
• Chart: 5m or 15m.
• OR: 15 min starting 08:00 Europe/London.
• Signals: Use defaults; keep ATR buffer = 0.2 and Retest = ON, Min Confidence ≥ 55.
• Play:
• BUY when price breaks LDN OR High + buffer and stays above VWAP; retest confirms.
• Trail behind VWAP or band #1; partials into band #2.
2) NAS100, New York breakout & run
• Chart: 5m.
• NY window: 09:30 America/New_York, OR = 15 min.
• Retest OFF on high momentum days; Min Confidence ≥ 60.
• Use band mode Stdev, bandLen=50, show ±1/±2.
• Momentum continuation: add on pullbacks that hold above VWAP after the breakout.
3) XAUUSD, London fake & VWAP fade
• Chart: 5m.
• Keep Retest ON; accept only shorts that break OR Low but retest fails back under VWAP.
• Confidence gate ≥ 50 to allow more mean-reversion setups.
⸻
Pro tips
• Adjust ATR buffer to the instrument: FX 0.15–0.25, indices 0.20–0.35, metals 0.20–0.30.
• Retest ON for choppy conditions; OFF for news momentum.
• Use VWAP bands: take partials at ±1; stretch targets at ±2/±3.
• Session timezones are explicit (London/New York). Ensure they match your instrument’s behavior.
• Pair with a higher-TF bias (e.g., 1H/4H trend) for directional filtering.
⸻
Alerts (ready to use)
• ORB+SVWAP — LDN Long, LDN Short, NY Long, NY Short
(Respect your cooldown; alerts fire only after confirmation and confidence gate.)
⸻
Known limits & notes
• Designed for intraday. On 1D+ charts, session windows compress.
• If your broker session differs from London/NY clocks on a holiday, adjust input times.
• Session-anchored VWAP uses the script’s signal window, not exchange sessions, by design.

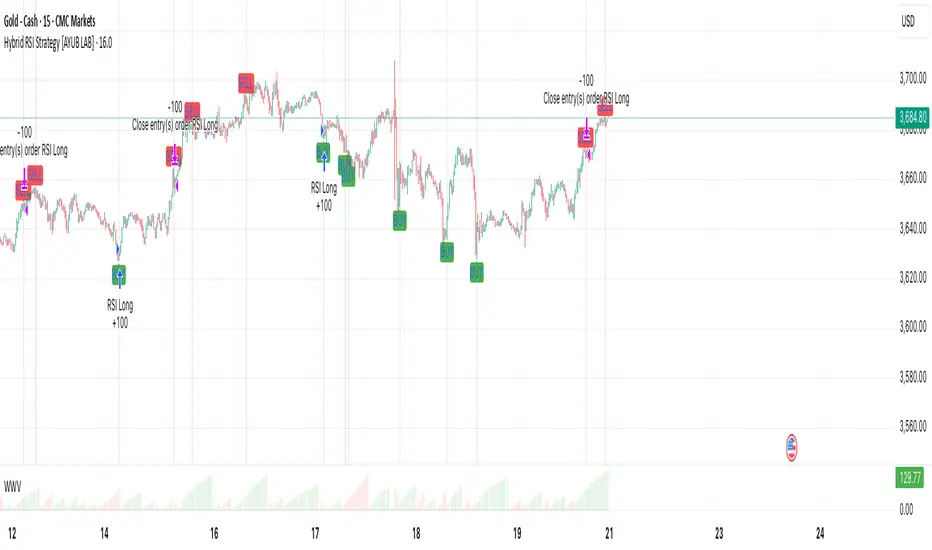
Hybrid RSI Strategy [Heifereum ]This is a hybrid script that combines visual RSI indicator signals with an optional backtestable trading strategy.
BUY Entry: When RSI crosses above the oversold level (default 30)
SELL Exit: When RSI crosses below the overbought level (default 70)
Timeframe: Works best on trending assets (crypto, forex, indices) in 5min to 1H
Backtest Toggle: Turn ON/OFF live testing using the Enable Backtest Mode? setting
Visual Cues: Buy/Sell labels, background coloring, and alerts ready for webhook automation
Use this strategy to visually explore RSI dynamics, run performance backtests, or hook up to external bots via alerts.
EMA50 + SR Boxes + VP Right + ATR + SL% + Entries + SentimentThis indicator combines several pro-grade building blocks to read the market at a glance:
EMA50 as a trend filter.
Smart Support/Resistance zones (rectangles) detected where price has touched multiple times.
“U / Inverted U” markers (confirmed pivots).
Optional Buy/Sell signals: only when a U appears inside a support zone with price above the EMA50 (buy), or an inverted U inside a resistance zone with price below the EMA50 (sell).
Simplified right-side Volume Profile (with a special Forex fallback if volume isn’t usable).
ATR & SL%: displays current ATR and an SL% based on ATR(100) Daily / Close × 100, attached to the latest candle.

Trend Magic EMA RMI Trend Sniper📌 Indicator Name:
Trend Magic + EMA + MA Smoothing + RMI Trend Sniper
📝 Description:
This is a multi-functional trend and momentum indicator that combines four powerful tools into a single overlay:
Trend Magic – Plots a dynamic support/resistance line based on CCI and ATR.
Helps identify trend direction (green = bullish, red = bearish).
Acts as a trailing stop or dynamic level for trade entries/exits.
Exponential Moving Average (EMA) – Smooths price data to highlight the underlying trend.
Customizable length, source, and offset.
Serves as a trend filter or moving support/resistance.
MA Smoothing + Bollinger Bands (Optional) – Adds a secondary smoothing filter based on your choice of SMA, EMA, WMA, VWMA, or SMMA.
Optional Bollinger Bands visualize volatility expansion/contraction.
Great for spotting consolidations and breakout opportunities.
RMI Trend Sniper – A momentum-based system combining RSI and MFI.
Highlights bullish (green) or bearish (red) conditions.
Plots a Range-Weighted Moving Average (RWMA) channel to gauge price positioning.
Provides visual BUY/SELL labels and optional bar coloring for fast decision-making.
📊 Uses & Trading Applications:
✅ Trend Identification: Spot the dominant market direction quickly with Trend Magic & EMA.
✅ Momentum Confirmation: RMI Sniper helps confirm whether the market has strong bullish or bearish pressure.
✅ Dynamic Support/Resistance: Trend Magic & EMA act as adaptive levels for stop-loss or trailing positions.
✅ Volatility Analysis: Optional Bollinger Bands show squeezes and potential breakout setups.
✅ Entry/Exit Signals: BUY/SELL alerts and color-coded candles make spotting trade opportunities simple.
💡 Best Use Cases:
Swing Trading: Follow Trend Magic + EMA alignment for higher probability trades.
Scalping/Intraday: Use RMI signals with bar coloring for quick momentum entries.
Trend Following Strategies: Ride trends until Trend Magic flips direction.
Breakout Trading: Watch for price closing outside the Bollinger Bands with RMI confirmation.

Supertrend DashboardOverview
This dashboard is a multi-timeframe technical indicator dashboard based on Supertrend. It combines:
Trend detection via Supertrend
Momentum via RSI and OBV (volume)
Volatility via a basic candle-based metric (bs)
Trend strength via ADX
Multi-timeframe analysis to see whether the trend is bullish across different timeframes
It then displays this info in a table on the chart with colors for quick visual interpretation.
2️⃣ Inputs
Dashboard settings:
enableDashboard: Toggle the dashboard on/off
locationDashboard: Where the table appears (Top right, Bottom left, etc.)
sizeDashboard: Text size in the table
strategyName: Custom name for the strategy
Indicator settings:
factor (Supertrend factor): Controls how far the Supertrend lines are from price
atrLength: ATR period for Supertrend calculation
rsiLength: Period for RSI calculation
Visual settings:
colorBackground, colorFrame, colorBorder: Control dashboard style
3️⃣ Core Calculations
a) Supertrend
Supertrend is a trend-following indicator that generates bullish or bearish signals.
Logic:
Compute ATR (atr = ta.atr(atrLength))
Compute preliminary bands:
upperBand = src + factor * atr
lowerBand = src - factor * atr
Smooth bands to avoid false flips:
lowerBand := lowerBand > prevLower or close < prevLower ? lowerBand : prevLower
upperBand := upperBand < prevUpper or close > prevUpper ? upperBand : prevUpper
Determine direction (bullish / bearish):
dir = 1 → bullish
dir = -1 → bearish
Supertrend line = lowerBand if bullish, upperBand if bearish
Output:
st → line to plot
bull → boolean (true = bullish)
b) Buy / Sell Trigger
Logic:
bull = ta.crossover(close, supertrend) → close crosses above Supertrend → buy signal
bear = ta.crossunder(close, supertrend) → close crosses below Supertrend → sell signal
trigger → checks which signal was most recent:
trigger = ta.barssince(bull) < ta.barssince(bear) ? 1 : 0
1 → Buy
0 → Sell
c) RSI (Momentum)
rsi = ta.rsi(close, rsiLength)
Logic:
RSI > 50 → bullish
RSI < 50 → bearish
d) OBV / Volume Trend (vosc)
OBV tracks whether volume is pushing price up or down.
Manual calculation (safe for all Pine versions):
obv = ta.cum( math.sign( nz(ta.change(close), 0) ) * volume )
vosc = obv - ta.ema(obv, 20)
Logic:
vosc > 0 → bullish
vosc < 0 → bearish
e) Volatility (bs)
Measures how “volatile” the current candle is:
bs = ta.ema(math.abs((open - close) / math.max(high - low, syminfo.mintick) * 100), 3)
Higher % → stronger candle moves
Displayed on dashboard as a number
f) ADX (Trend Strength)
= ta.dmi(14, 14)
Logic:
adx > 20 → Trending
adx < 20 → Ranging
g) Multi-Timeframe Supertrend
Timeframes: 1m, 3m, 5m, 10m, 15m, 30m, 1H, 2H, 4H, 12H, 1D
Logic:
for tf in timeframes
= request.security(syminfo.tickerid, tf, f_supertrend(ohlc4, factor, atrLength))
array.push(tf_bulls, bull_tf ? 1.0 : 0.0)
bull_tf ? 1.0 : 0.0 → converts boolean to number
Then we calculate user rating:
userRating = (sum of bullish timeframes / total timeframes) * 10
0 → Strong Sell, 10 → Strong Buy
4️⃣ Dashboard Table Layout
Row Column 0 (Label) Column 1 (Value)
0 Strategy strategyName
1 Technical Rating textFromRating(userRating) (color-coded)
2 Current Signal Buy / Sell (based on last Supertrend crossover)
3 Current Trend Bullish / Bearish (based on Supertrend)
4 Trend Strength bs %
5 Volume vosc → Bullish/Bearish
6 Volatility adx → Trending/Ranging
7 Momentum RSI → Bullish/Bearish
8 Timeframe Trends 📶 Merged cell
9-19 1m → Daily Bullish/Bearish for each timeframe (green/red)
5️⃣ Color Logic
Green shades → bullish / trending / buy
Red / orange → bearish / weak / sell
Yellow → neutral / ranging
Example:
dashboard_cell_bg(1, 1, colorFromRating(userRating))
dashboard_cell_bg(1, 2, trigger ? color.green : color.red)
dashboard_cell_bg(1, 3, superBull ? color.green : color.red)
Makes the dashboard visually intuitive
6️⃣ Key Logic Flow
Calculate Supertrend on current timeframe
Detect buy/sell triggers based on crossover
Calculate RSI, OBV, Volatility, ADX
Request Supertrend on multiple timeframes → convert to 1/0
Compute user rating (percentage of bullish timeframes)
Populate dashboard table with colors and values
✅ The result: You get a compact, fast, multi-timeframe trend dashboard that shows:
Current signal (Buy/Sell)
Current trend (Bullish/Bearish)
Momentum, volatility, and volume cues
Trend across multiple timeframes
Overall technical rating
It’s essentially a full trend-strength scanner directly on your chart.

MACD Scaled Overlay█ OVERVIEW
The "MACD Scaled Overlay" indicator is an advanced version of the classic MACD (Moving Average Convergence Divergence) oscillator that displays signals directly on the price chart. Instead of a traditional separate panel, the MACD line, signal line, and histogram are scaled and overlaid on the price chart, making it easier to identify key price levels and potential reversal points. The indicator also supports the detection of divergences (regular and hidden) and offers extensive customization options, such as adjusting colors, line thickness, and enabling/disabling visual elements.
█ CONCEPTS
The "MACD Scaled Overlay" indicator is designed to simplify trend and reversal analysis by integrating MACD signals with the price chart. The MACD Scaled Overlay is scaled relative to the average candle range, allowing the lines and histogram to dynamically adjust to market volatility. Additionally, the indicator enables the detection of divergences (bullish and bearish, both regular and hidden) based on the traditional MACD histogram (before scaling), ensuring consistency with classic divergence analysis. The indicator is most effective when combined with other technical analysis tools, such as Fibonacci levels, pivot points, or trend lines.
█ MACD Calculations and Scaling
The indicator is based on the classic MACD formula, which includes:
-MACD Line: The difference between the fast EMA (default: 12) and the slow EMA (default: 26).
-Signal Line: The EMA of the MACD line (default: 9).
-Histogram: The difference between the MACD line and the signal line.
Scaling is achieved by normalizing the MACD values relative to the standard deviation and the average candle range. This makes the lines and histogram dynamically adjust to market volatility, improving their readability and utility on the price chart. The scaling formulas are:
-MACD Scaled: macdNorm * avgRangeLines * scaleFactor
-Signal Scaled: signalNorm * avgRangeLines * scaleFactor
-Histogram Scaled: histNorm * avgRangeHist * scaleFactor
Where:
-macdNorm and signalNorm are the normalized MACD and signal line values.
-avgRangeLines and avgRangeHist are the average candle ranges.
-scaleFactor is the scaling multiplier (default: 2).
The positioning of the lines and histogram is relative to the candle midpoint (candleMid = (high + low) / 2), ensuring proper display on the price chart. Divergences are calculated based on the traditional MACD histogram (before scaling), maintaining consistency with standard divergence detection methodology.
█INDICATOR FEATURES
-Dynamic MACD and Signal Lines: Scaled and overlaid on the price chart, facilitating the identification of reversal points.
-Histogram: Displays the difference between the MACD and signal lines, dynamically adjusted to market volatility.
-Divergence Detection: Ability to detect regular and hidden divergences (bullish and bearish) based on the traditional MACD histogram, with options to enable/disable their display.
-Visual Customization: Options to adjust colors, line thickness, transparency, and enable/disable elements such as the zero line, MACD line, signal line, or histogram.
-Smoothing: Smoothing length for lines (default: 1) and histogram (default: 3). Smoothing may delay crossover signals, which should be considered during analysis.
-Alerts: Alert conditions for MACD and signal line crossovers, enabling notifications for potential buy/sell signals.
█ HOW TO SET UP THE INDICATOR
-Add the "MACD Scaled Overlay" indicator to your TradingView chart.
-Configure parameters in the settings, such as EMA lengths, scaling multiplier, or smoothing periods, to match your trading style.
-Enable or disable the display of the zero line, MACD line, signal line, or histogram based on your needs.
-Adjust colors and line thickness in the "Style" section and transparency settings in the input section to optimize visualization.
█ HOW TO USE
Add the indicator to your chart, configure the parameters, and observe the interactions of the price with the MACD line, signal line, and histogram to identify potential entry and exit points. Key signals include:
-MACD and Signal Line Crossovers: A crossover of the MACD line above the signal line may indicate a buy signal (bullish cross), while a crossover below the signal line may indicate a sell signal (bearish cross).
-Crossings Through the Price Line (Zero): The MACD line or histogram crossing the price line (candle midpoint) may indicate a change in momentum. For example, the histogram moving from negative to positive values near the price line may signal increasing bullish trend strength.
-Divergences: Detection of regular and hidden divergences (bullish and bearish) based on the traditional MACD histogram can help predict trend reversals. Divergences are not standalone signals, as they are delayed by the specified pivot length (default: 3). However, they help strengthen the significance of other signals, such as crossovers or support/resistance levels.
The indicator is most effective when combined with other tools, such as Fibonacci levels, pivot points, or support/resistance lines, to confirm signals.

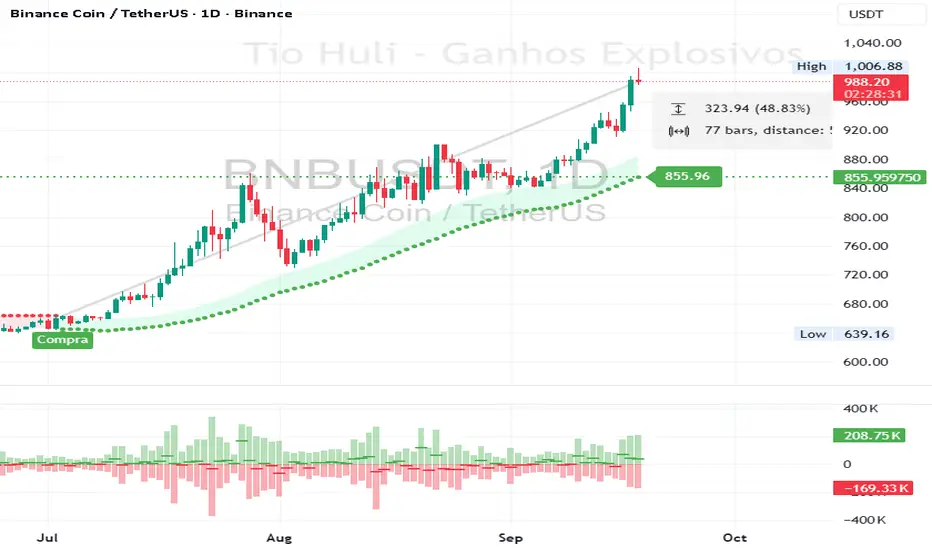
CHiLo — Custom HiLo (SMA/EMA, Activator, Shading, Auto-Decimals)CHiLo is a clean Hi/Lo trend read with SMA/EMA options, a HiLo vs. HiLo Activator mode, optional band shading , and a right-side HiLo marker with automatic decimals based on the symbol. Optional Buy/Sell labels mark state flips. Inspired by the broader trend-following literature and practitioners; in Brazil, educator Hulisses “Tio Huli” Dias is a notable voice popularizing trend following.
What it does
CHiLo plots a Hi/Lo state with two modes:
HiLo (classic high/low bands)
HiLo Activator (activator-style behavior)
It includes:
SMA/EMA selection
Optional shading between Hi/Lo bands
Optional Buy/Sell labels on state flips
HiLo marker (auto-decimals from the symbol’s tick size)
Goal: deliver a fast, visual trend context that you can pair with your own risk rules and confirmations.
How to use
Add the indicator and choose Mode (HiLo / Activator) and MA type (SMA/EMA).
Tune Period (and Offset if needed). Higher = smoother (fewer flips); lower = more responsive.
Toggle Shading to emphasize the envelope.
Toggle Buy/Sell labels if you want flip markers.
Use the HiLo marker on the right to read the current level (auto-formatted).
Inputs (quick reference)
Period / Offset — sensitivity vs. delay.
Type — HiLo or HiLo Activator.
MA Type — SMA (steadier) or EMA (snappier).
HiLo Style — Points or Line.
Shading & Transparency — highlight the band area.
Buy/Sell Labels — on/off.
HiLo Marker — size and horizontal offset (decimals automatic).
Notes & credits
Educational use only; not financial advice.
For best results, combine with position sizing, stops, and regime filters.
Ultimate Sniper Entry - Pivot PerfectionT2R📌 Description
The Ultimate Sniper Entry – Pivot Perfection is a precision trading tool designed to identify high-probability pivot points and generate early buy/sell entries with strong confirmation. By combining pivot detection, volume spikes, momentum filters (RSI), candle patterns, and EMA trend alignment, this system helps traders capture market reversals and trend continuation setups with improved accuracy.
It offers:
Smart Pivot Detection with adjustable sensitivity.
Multi-layer Confirmation: volume, momentum, candle structure, and EMA trend filter.
Non-Repainting Signals: arrows plotted only after pivot confirmation.
Visual Aids: buy/sell arrows, optional pivot markers, background trend shading.
Alerts: instant notifications for sniper buy/sell entries.
Info Panel: quick reference guide directly on chart.
Ideal for traders who want structured, rules-based entries while avoiding false signals, the Ultimate Sniper Entry system adapts to multiple markets and timeframes.

Pullback & ATR Trailing Strategy※日本語は英文の次に記載あります。
Overview
This indicator combines short-term RSI pullback/rebound signals with long-term RSI divergence to visualize potential buy and sell opportunities.
It also plots ATR-based trailing stops and partial take-profit lines, making it suitable for day trading and short-term trading.
Alerts are triggered when signal conditions are met.
Key Features
Detect short-term RSI pullbacks/rebounds (default 6 periods)
Detect divergences on long-term RSI
Visualize buy/sell signals with labels
Display ATR-based trailing stop and partial take-profit lines
Trigger alerts when conditions are met
Settings Explanation
Short-term RSI Length (rsiShortLen) Period for short-term RSI used to detect pullbacks or rebounds
Pullback Threshold (levelLow) RSI level below which a buy signal is considered
Rebound Threshold (levelHigh) RSI level above which a sell signal is considered
Long-term Timeframe (longTF) Timeframe used for divergence detection
Long-term RSI Length (longRSILen) Period for RSI on the long-term timeframe, used for divergence detection
Pivot Width Left / Right (pivotLeft / pivotRight)
Determines how we detect swing highs/lows (peaks and valleys).
For example, with pivotLeft=3 and pivotRight=3, a bar is considered a swing high if it is higher than the 3 bars to its left and 3 bars to its right.
Larger numbers detect only bigger swings, smaller numbers also detect smaller swings.
ATR Length (atrLen) Period for ATR calculation for trailing stops
ATR Multiplier (atrMult) Multiplier for ATR to calculate trailing stop distance
Partial Take-Profit Multiplier (tpMult) Multiplier to calculate half-profit level based on swing amplitude
Green line (Long Trail / translucent green)
ATR-based trailing stop line for long positions.
Used as a stop-loss or trailing stop for open buy trades.
Dark green line shows partial take-profit (TP), translucent green shows trailing stop level.
Red line (Short Trail / translucent red)
ATR-based trailing stop line for short positions.
Used as a stop-loss or trailing stop for open sell trades.
Dark red line shows partial take-profit (TP), translucent red shows trailing stop level.
Note: TP lines indicate partial take-profit targets, while ATR trailing lines indicate stop-loss/trailing stop levels if the price moves against the position.
日本語説明ーーーーーーーーーーーーーーーーーーーーーーーーーーーー
概要
このインジケーターは、短期RSIの押し目/戻りシグナルと、長期足RSIによるダイバージェンスを組み合わせて、買い・売りのチャンスを可視化します。
さらに、ATRベースのトレールストップラインや半分利確ラインも表示し、デイトレードや短期トレードに最適化しています。
シグナル条件に一致した場合にアラートも作動します。
主な機能
短期RSI(デフォルト6期間)で押し目・戻りを検出
長期足RSIでのダイバージェンスを検出
BUY/SELLラベルでシグナルを視覚化
ATRベースのトレールライン・半分利確ラインを表示
条件一致時にアラート発動
各設定の説明
短期RSI期間 (rsiShortLen) デイトレ用の短期RSIの期間。押し目や戻りのシグナルに使用
押し目閾値 (levelLow) RSIが下回ったら買いシグナル判定に使用
戻り閾値 (levelHigh) RSIが上回ったら売りシグナル判定に使用
長期足 (longTF) ダイバージェンス判定用の長期足の時間軸
長期RSI期間 (longRSILen) 長期足で計算するRSIの期間。ダイバージェンス判定に使用
左右ピボット幅 (pivotLeft / pivotRight) 高値や安値を「スイングの山・谷」として判定する時に使う幅です。
例えば pivotLeft=3, pivotRight=3 の場合、「左に3本、右に3本のローソク足より高い/低い点」をスイングの頂点や底と見なします。
数値を大きくすると大きな波だけを拾い、小さくすると小さな波も拾いやすくなります。
ATR期間 (atrLen) トレールライン計算用ATRの期間
ATR倍率 (atrMult) トレールラインの距離をATRに掛ける倍率
半分利確倍率 (tpMult) 押し目/戻り幅に対して半分利確ラインを設定する倍率
緑の線(Long Trail / 半透明緑)
ATRベースのトレールストップラインです。
買いポジション中の損切り目安やトレーリングストップとして使います。
緑の濃い線は半分利確ライン(TP)、薄い緑の線はトレールストップの位置を示します。
赤い線(Short Trail / 半透明赤)
ATRベースのトレールストップラインです。
売りポジション中の損切り目安やトレーリングストップとして使います。
赤の濃い線は半分利確ライン(TP)、薄い赤の線はトレールストップの位置を示します。
補足:TP(Take Profit)線は半分利確の目安で、ATRトレールラインはポジションが逆行した時の損切り目安です。

Structural Liquidity Signals [BullByte]Structural Liquidity Signals (SFP, FVG, BOS, AVWAP)
Short description
Detects liquidity sweeps (SFPs) at pivots and PD/W levels, highlights the latest FVG, tracks AVWAP stretch, arms percentile extremes, and triggers after confirmed micro BOS.
Full description
What this tool does
Structural Liquidity Signals shows where price likely tapped liquidity (stop clusters), then waits for structure to actually change before it prints a trigger. It spots:
Liquidity sweeps (SFPs) at recent pivots and at prior day/week highs/lows.
The latest Fair Value Gap (FVG) that often “pulls” price or serves as a reaction zone.
How far price is stretched from two VWAP anchors (one from the latest impulse, one from today’s session), scaled by ATR so it adapts to volatility.
A “percentile” extreme of an internal score. At extremes the script “arms” a setup; it only triggers after a small break of structure (BOS) on a closed bar.
Originality and design rationale, why it’s not “just a mashup”
This is not a mashup for its own sake. It’s a purpose-built flow that links where liquidity is likely to rest with how structure actually changes:
- Liquidity location: We focus on areas where stops commonly cluster—recent pivots and prior day/week highs/lows—then detect sweeps (SFPs) when price wicks beyond and closes back inside.
- Displacement context: We track the last Fair Value Gap (FVG) to account for recent inefficiency that often acts as a magnet or reaction zone.
- Stretch measurement: We anchor VWAP to the latest N-bar impulse and to the Daily session, then normalize stretch by ATR to assess dislocation consistently across assets/timeframes.
- Composite exhaustion: We combine stretch, wick skew, and volume surprise, then bend the result with a tanh transform so extremes are bounded and comparable.
- Dynamic extremes and discipline: Rather than triggering on every sweep, we “arm” at statistical extremes via percent-rank and only fire after a confirmed micro Break of Structure (BOS). This separates “interesting” from “actionable.”
Key concepts
SFP (liquidity sweep): A candle briefly trades beyond a level (where stops sit) and closes back inside. We detect these at:
Pivots (recent swing highs/lows confirmed by “left/right” bars).
Prior Day/Week High/Low (PDH/PDL/PWH/PWL).
FVG (Fair Value Gap): A small 3‑bar gap (bar2 high vs bar1 low, or vice versa). The latest gap often acts like a magnet or reaction zone. We track the most recent Up/Down gap and whether price is inside it.
AVWAP stretch: Distance from an Anchored VWAP divided by ATR (volatility). We use:
Impulse AVWAP: resets on each new N‑bar high/low.
Daily AVWAP: resets each new session.
PR (Percentile Rank): Where the current internal score sits versus its own recent history (0..100). We arm shorts at high PR, longs at low PR.
Micro BOS: A small break of the recent high (for longs) or low (for shorts). This is the “go/no‑go” confirmation.
How the parts work together
Find likely liquidity grabs (SFPs) at pivots and PD/W levels.
Add context from the latest FVG and AVWAP stretch (how far price is from “fair”).
Build a bounded score (so different markets/timeframes are comparable) and compute its percentile (PR).
Arm at extremes (high PR → short candidate; low PR → long candidate).
Only print a trigger after a micro BOS, on a closed bar, with spacing/cooldown rules.
What you see on the chart (legend)
Lines:
Teal line = Impulse AVWAP (resets on new N‑bar extreme).
Aqua line = Daily AVWAP (resets each session).
PDH/PDL/PWH/PWL = prior day/week levels (toggle on/off).
Zones:
Greenish box = latest Up FVG; Reddish box = latest Down FVG.
The shading/border changes after price trades back through it.
SFP labels:
SFP‑P = SFP at Pivot (dotted line marks that pivot’s price).
SFP‑L = SFP at Level (at PDH/PDL/PWH/PWL).
Throttle: To reduce clutter, SFPs are rate‑limited per direction.
Triggers:
Triangle up = long trigger after BOS; triangle down = short trigger after BOS.
Optional badge shows direction and PR at the moment of trigger.
Optional Trigger Zone is an ATR‑sized box around the trigger bar’s close (for visualization only).
Background:
Light green/red shading = a long/short setup is “armed” (not a trigger).
Dashboard (Mini/Pro) — what each item means
PR: Percentile of the internal score (0..100). Near 0 = bullish extreme, near 100 = bearish extreme.
Gauge: Text bar that mirrors PR.
State: Idle, Armed Long (with a countdown), or Armed Short.
Cooldown: Bars remaining before a new setup can arm after a trigger.
Bars Since / Last Px: How long since last trigger and its price.
FVG: Whether price is in the latest Up/Down FVG.
Imp/Day VWAP Dist, PD Dist(ATR): Distance from those references in ATR units.
ATR% (Gate), Trend(HTF): Status of optional regime filters (volatility/trend).
How to use it (step‑by‑step)
Keep the Safety toggles ON (default): triggers/visuals on bar‑close, optional confirmed HTF for trend slope.
Choose timeframe:
Intraday (5m–1h) or Swing (1h–4h). On very fast/thin charts, enable Performance mode and raise spacing/cooldown.
Watch the dashboard:
When PR reaches an extreme and an SFP context is present, the background shades (armed).
Wait for the trigger triangle:
It prints only after a micro BOS on a closed bar and after spacing/cooldown checks.
Use the Trigger Zone box as a visual reference only:
This script never tells you to buy/sell. Apply your own plan for entry, stop, and sizing.
Example:
Bullish: Sweep under PDL (SFP‑L) and reclaim; PR in lower tail arms long; BOS up confirms → long trigger on bar close (ATR-sized trigger zone shown).
Bearish: Sweep above PDH/pivot (SFP‑L/P) and reject; PR in upper tail arms short; BOS down confirms → short trigger on bar close (ATR-sized trigger zone shown).
Settings guide (with “when to adjust”)
Safety & Stability (defaults ON)
Confirm triggers at bar close, Draw visuals at bar close: Keep ON for clean, stable prints.
Use confirmed HTF values: Applies to HTF trend slope only; keeps it from changing until the HTF bar closes.
Performance mode: Turn ON if your chart is busy or laggy.
Core & Context
ATR Length: Bigger = smoother distances; smaller = more reactive.
Impulse AVWAP Anchor: Larger = fewer resets; smaller = resets more often.
Show Daily AVWAP: ON if you want session context.
Use last FVG in logic: ON to include FVG context in arming/score.
Show PDH/PDL/PWH/PWL: ON to see prior day/week levels that often attract sweeps.
Liquidity & Microstructure
Pivot Left/Right: Higher values = stronger/rarer pivots.
Min Wick Ratio (0..1): Higher = only more pronounced SFP wicks qualify.
BOS length: Larger = stricter BOS; smaller = quicker confirmations.
Signal persistence: Keeps SFP context alive for a few bars to avoid flicker.
Signal Gating
Percent‑Rank Lookback: Larger = more stable extremes; smaller = more reactive extremes.
Arm thresholds (qHi/qLo): Move closer to 0.5 to see more arms; move toward 0/1 to see fewer arms.
TTL, Cooldown, Min bars and Min ATR distance: Space out triggers so you’re not reacting to minor noise.
Regime Filters (optional)
ATR percentile gate: Only allow triggers when volatility is at/above a set percentile.
HTF trend gate: Only allow longs when the HTF slope is up (and shorts when it’s down), above a minimum slope.
Visuals & UX
Only show “important” SFPs: Filters pivot SFPs by Volume Z and |Impulse stretch|.
Trigger badges/history and Max badge count: Control label clutter.
Compact labels: Toggle SFP‑P/L vs full names.
Dashboard mode and position; Dark theme.
Reading PR (the built‑in “oscillator”)
PR ~ 0–10: Potential bullish extreme (long side can arm).
PR ~ 90–100: Potential bearish extreme (short side can arm).
Important: “Armed” ≠ “Enter.” A trigger still needs a micro BOS on a closed bar and spacing/cooldown to pass.
Repainting, confirmations, and HTF notes
By default, prints wait for the bar to close; this reduces repaint‑like effects.
Pivot SFPs only appear after the pivot confirms (after the chosen “right” bars).
PD/W levels come from the prior completed candles and do not change intraday.
If you enable confirmed HTF values, the HTF slope will not change until its higher‑timeframe bar completes (safer but slightly delayed).
Performance tips
If labels/zones clutter or the chart lags:
Turn ON Performance mode.
Hide FVG or the Trigger Zone.
Reduce badge history or turn badge history off.
If price scaling looks compressed:
Keep optional “score”/“PR” plots OFF (they overlay price and can affect scaling).
Alerts (neutral)
Structural Liquidity: LONG TRIGGER
Structural Liquidity: SHORT TRIGGER
These fire when a trigger condition is met on a confirmed bar (with defaults).
Limitations and risk
Not every sweep/extreme reverses; false triggers occur, especially on thin markets and low timeframes.
This indicator does not provide entries, exits, or position sizing—use your own plan and risk control.
Educational/informational only; no financial advice.
License and credits
© BullByte - MPL 2.0. Open‑source for learning and research.
Built from repeated observations of how liquidity runs, imbalance (FVG), and distance from “fair” (AVWAPs) combine, and how a small BOS often marks the moment structure actually shifts.
